The Home of ResearchSpace
contact: info@kartography.org
contact: info@kartography.org
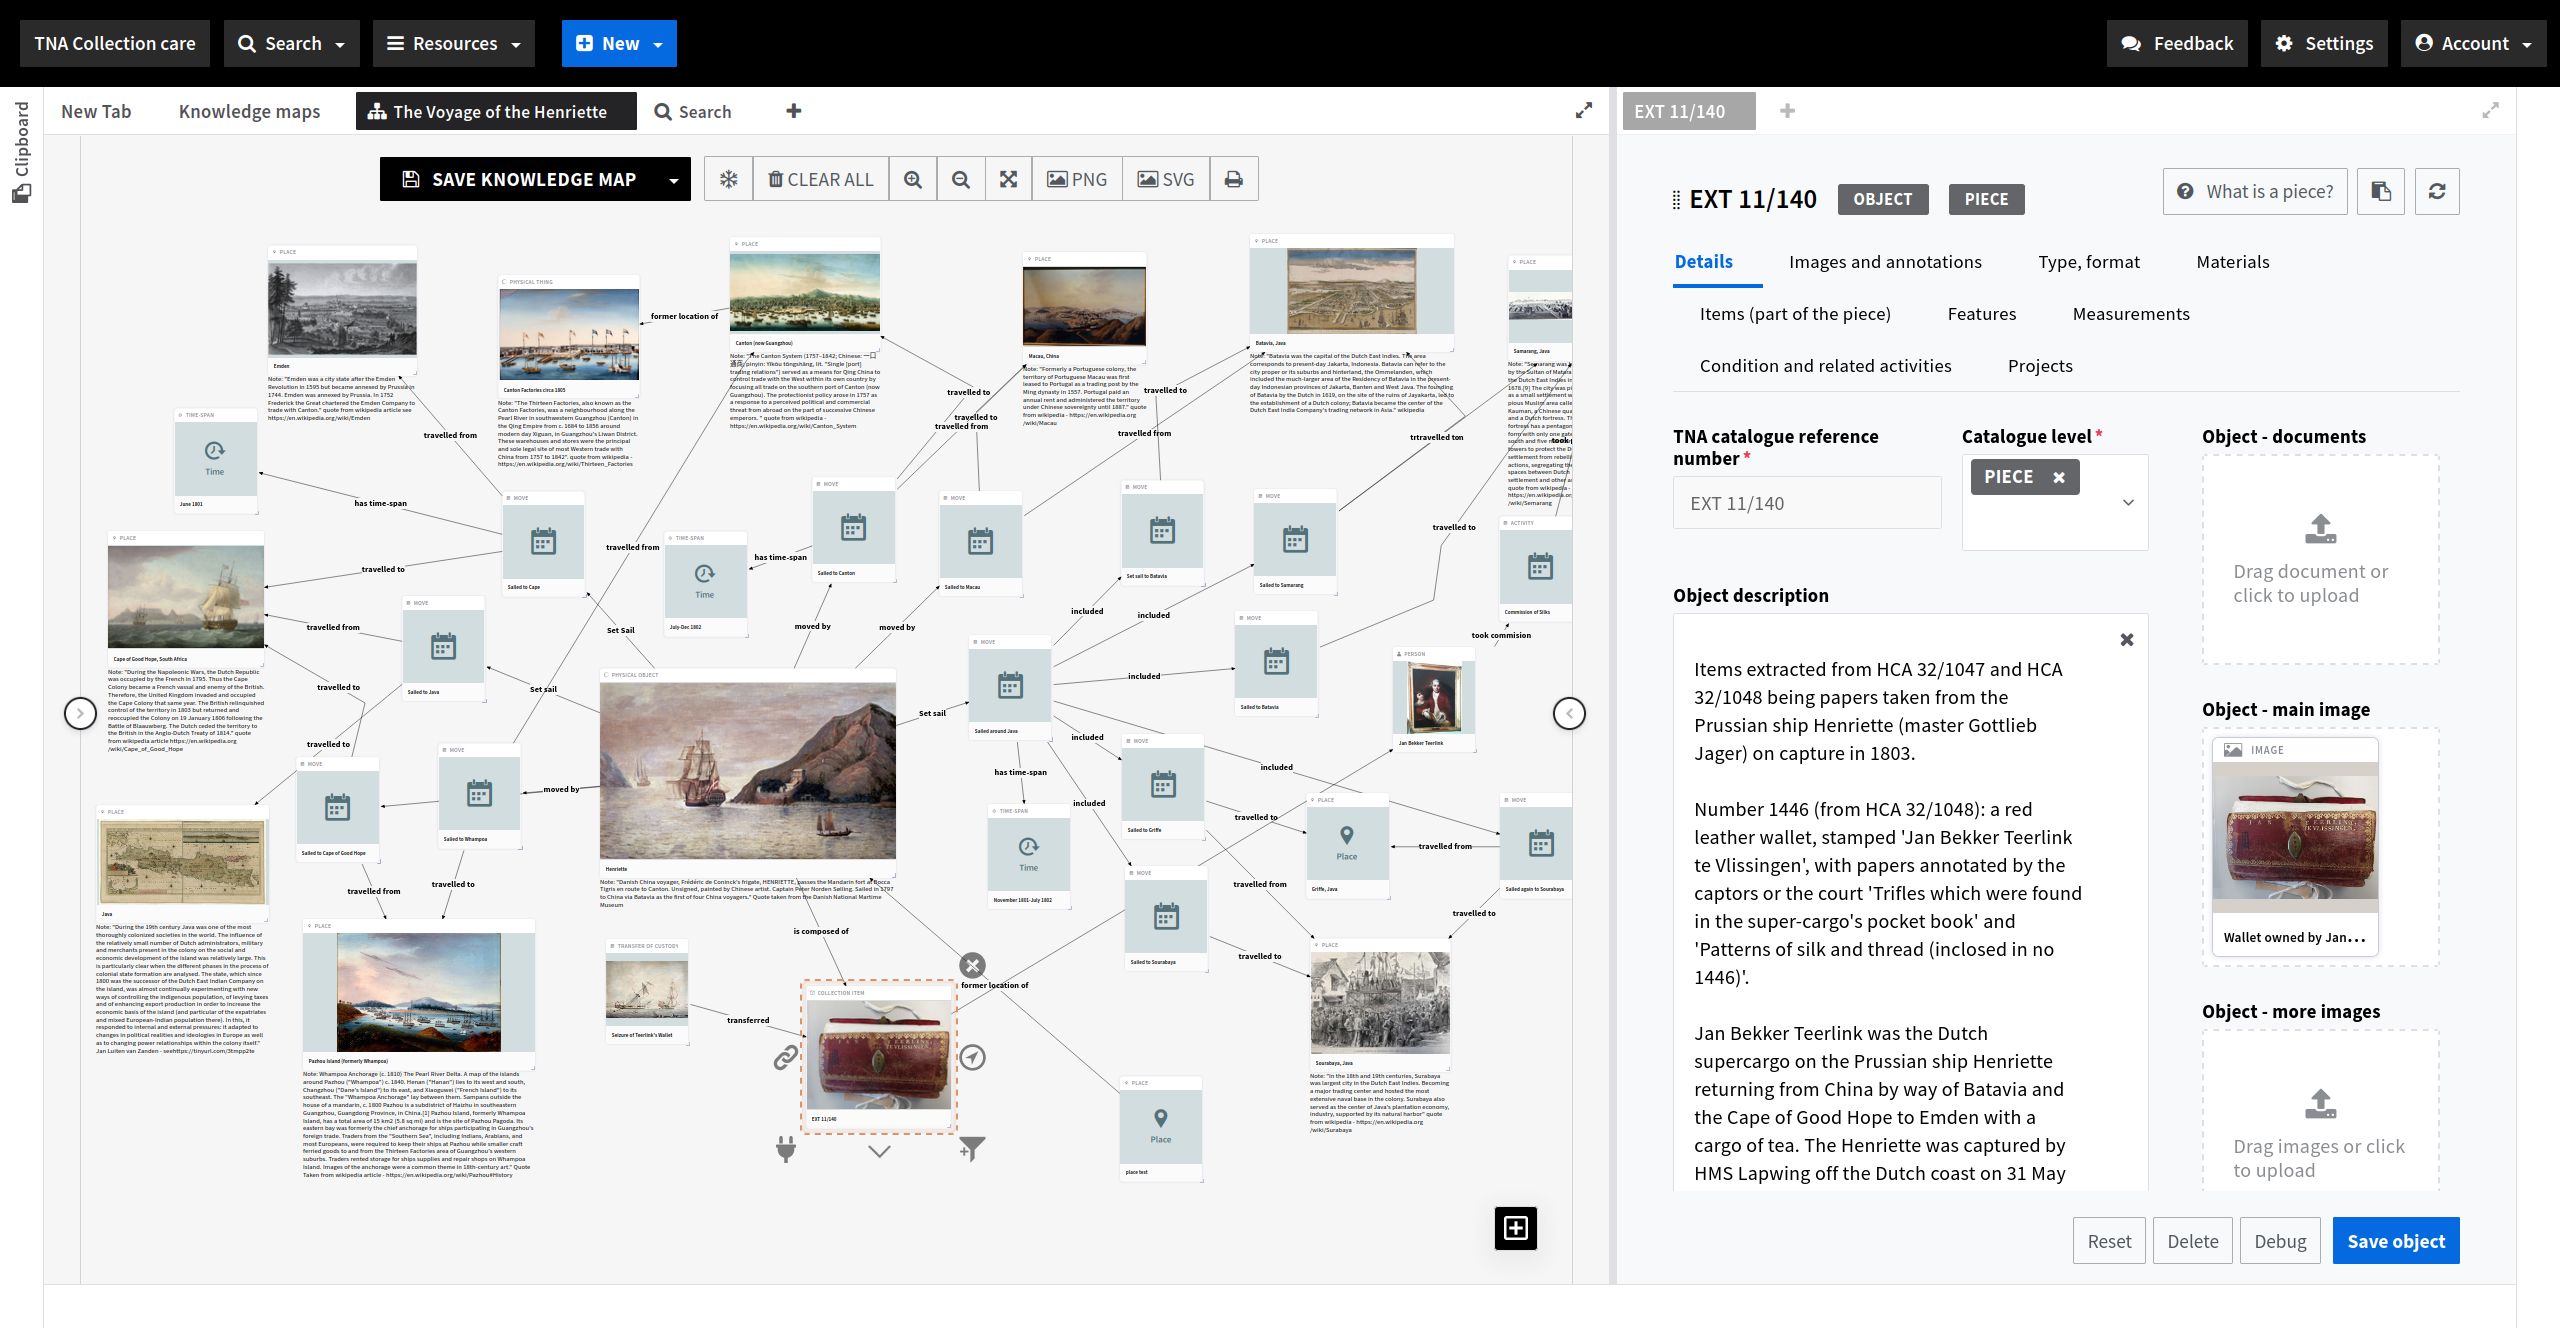
The knowledge base is visualised in different ways. Here an object, Jan Bekker Teerlink's Wallet crammed with seeds, documents and textile samples, is represented in one frame through a semantic form containing associated relations, and which can be authored independently of the other frame, which also represents Teerlinks wallet (and which initiates the semantic form) but is seen in the context of other processes it is interconencted to, in this case its journey on the ship, Henriette, bound on the silk route to China. The map represents it movement between different ports, for which more information is avialble about the people he met and negotiated trading deals with.
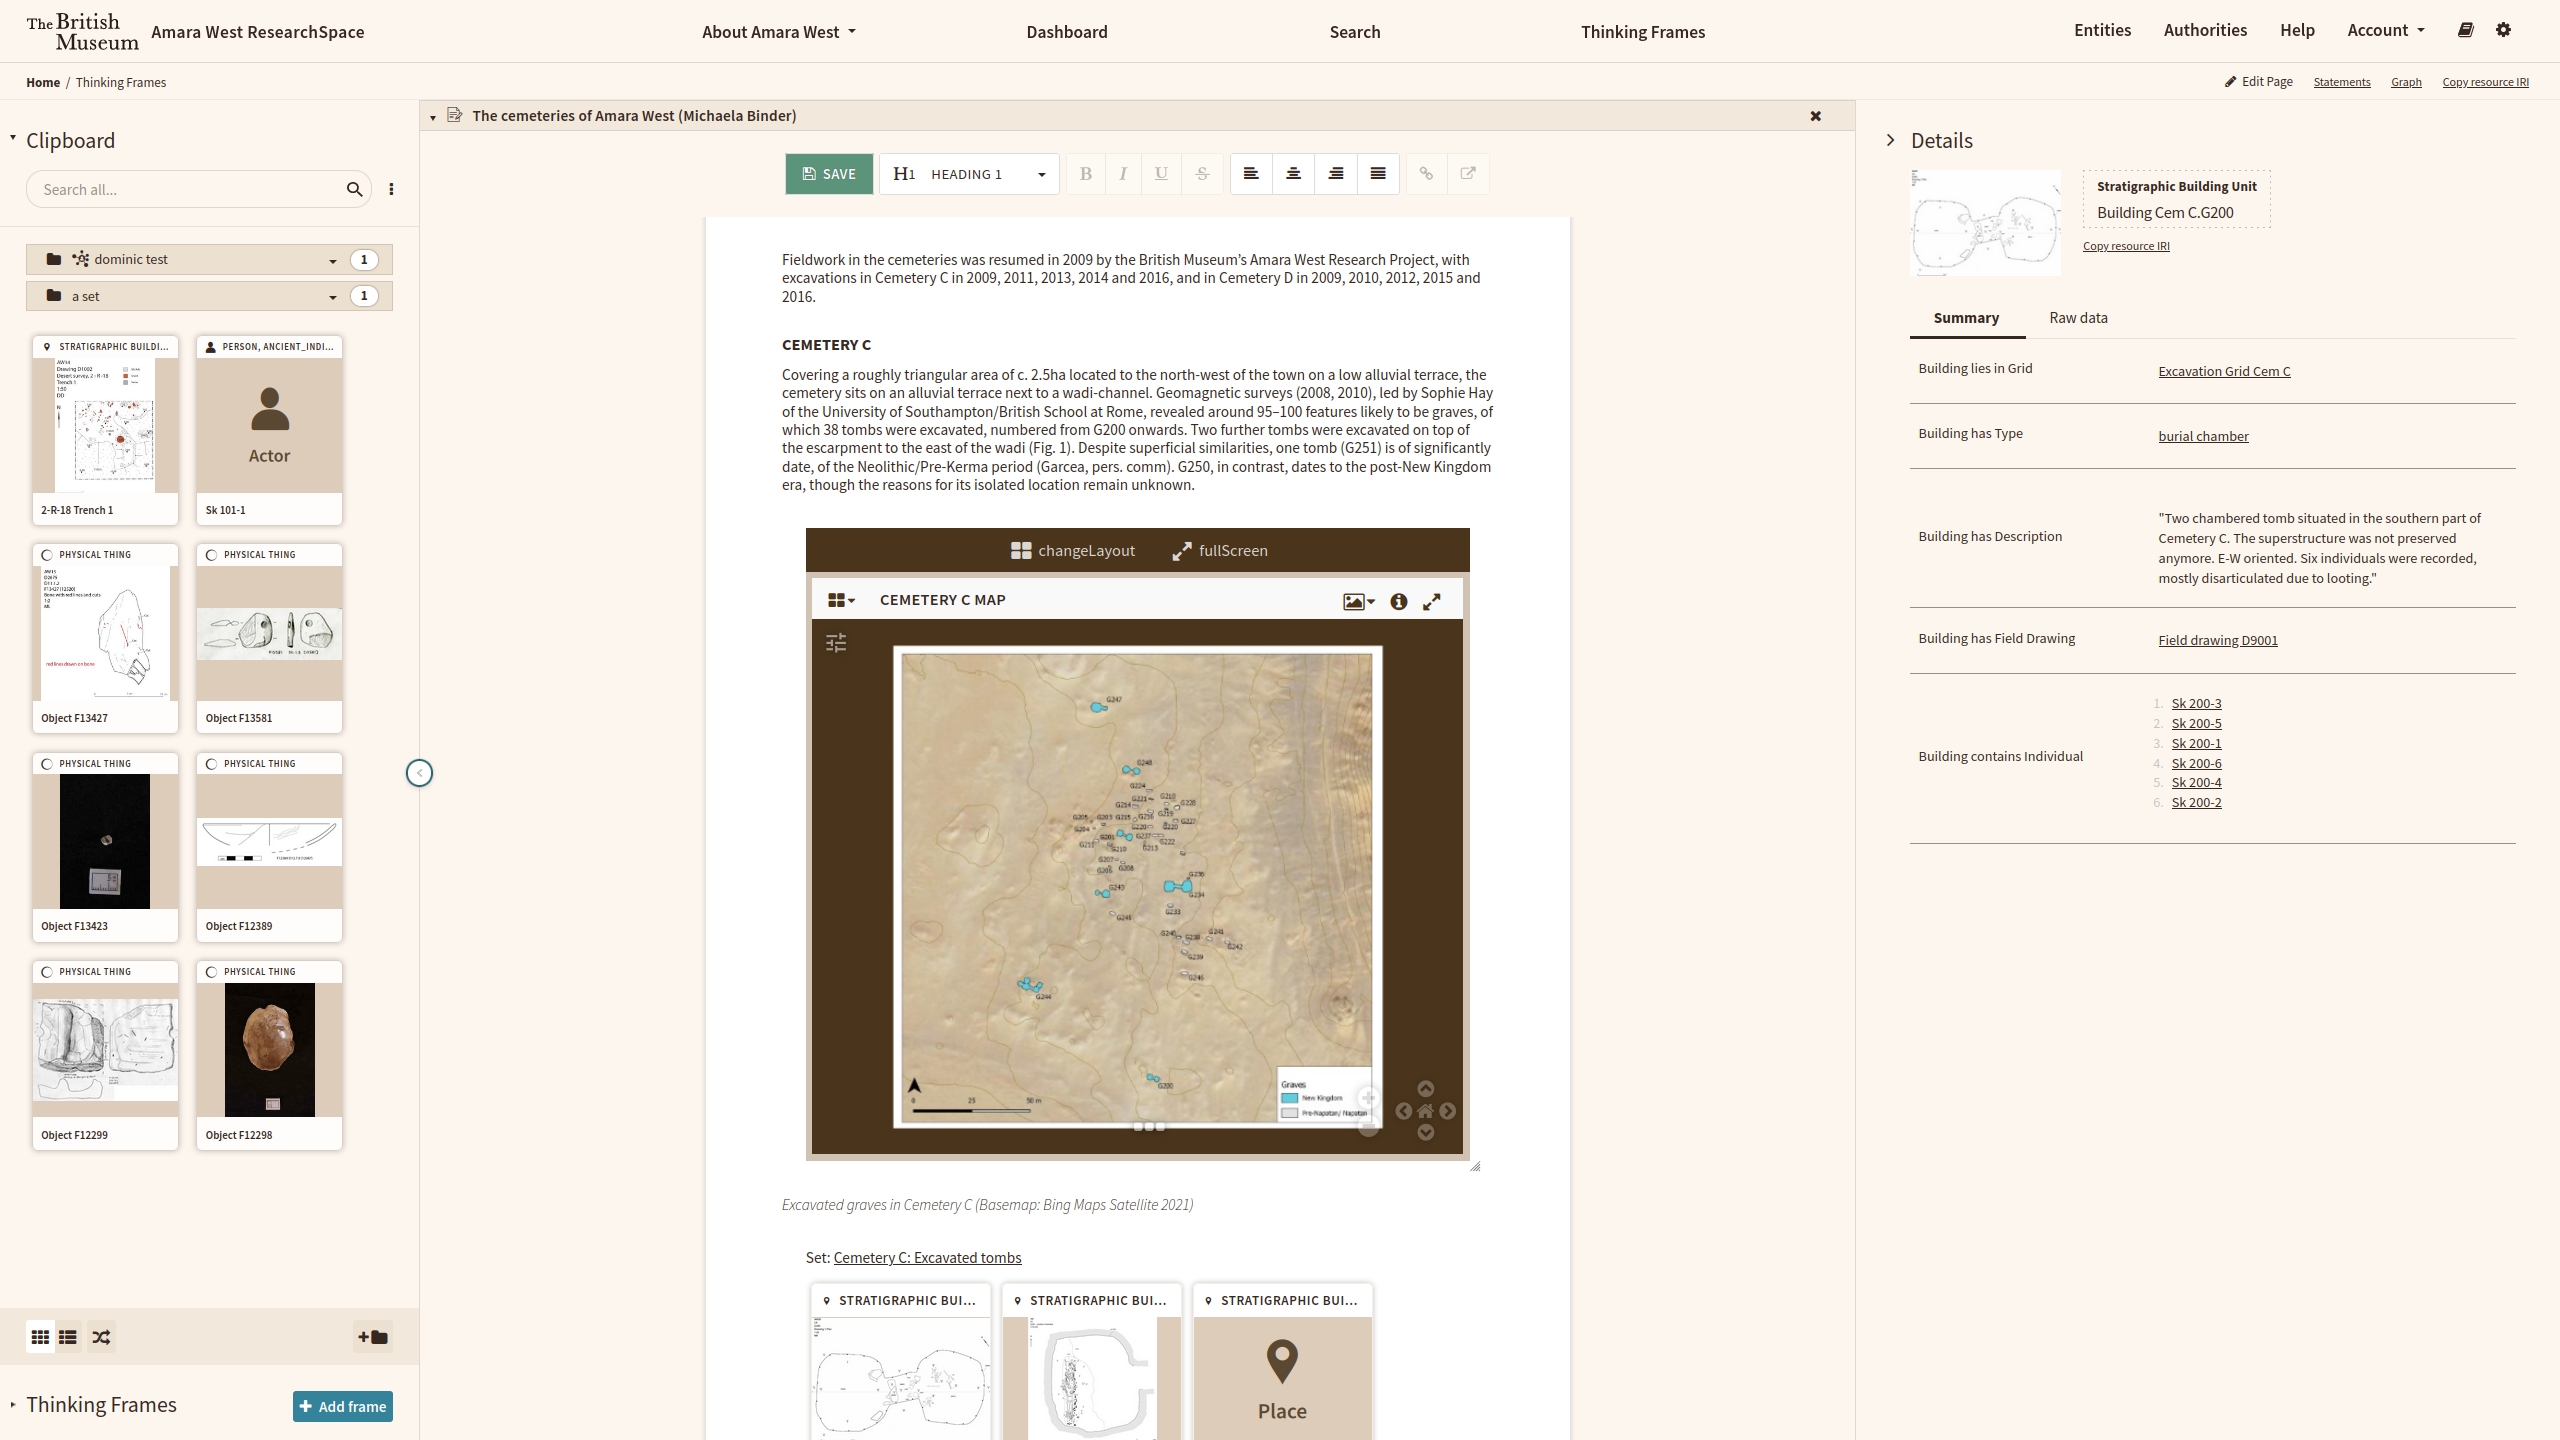
In the Amara West ResearchSpace, a representation of a Egyptian / Nubian archaeological site makes use of semantic narrtives allowing data to be dynamically embedded into articles and reports. These can be visualised in different ways, but also selected to see the data behind those representations.
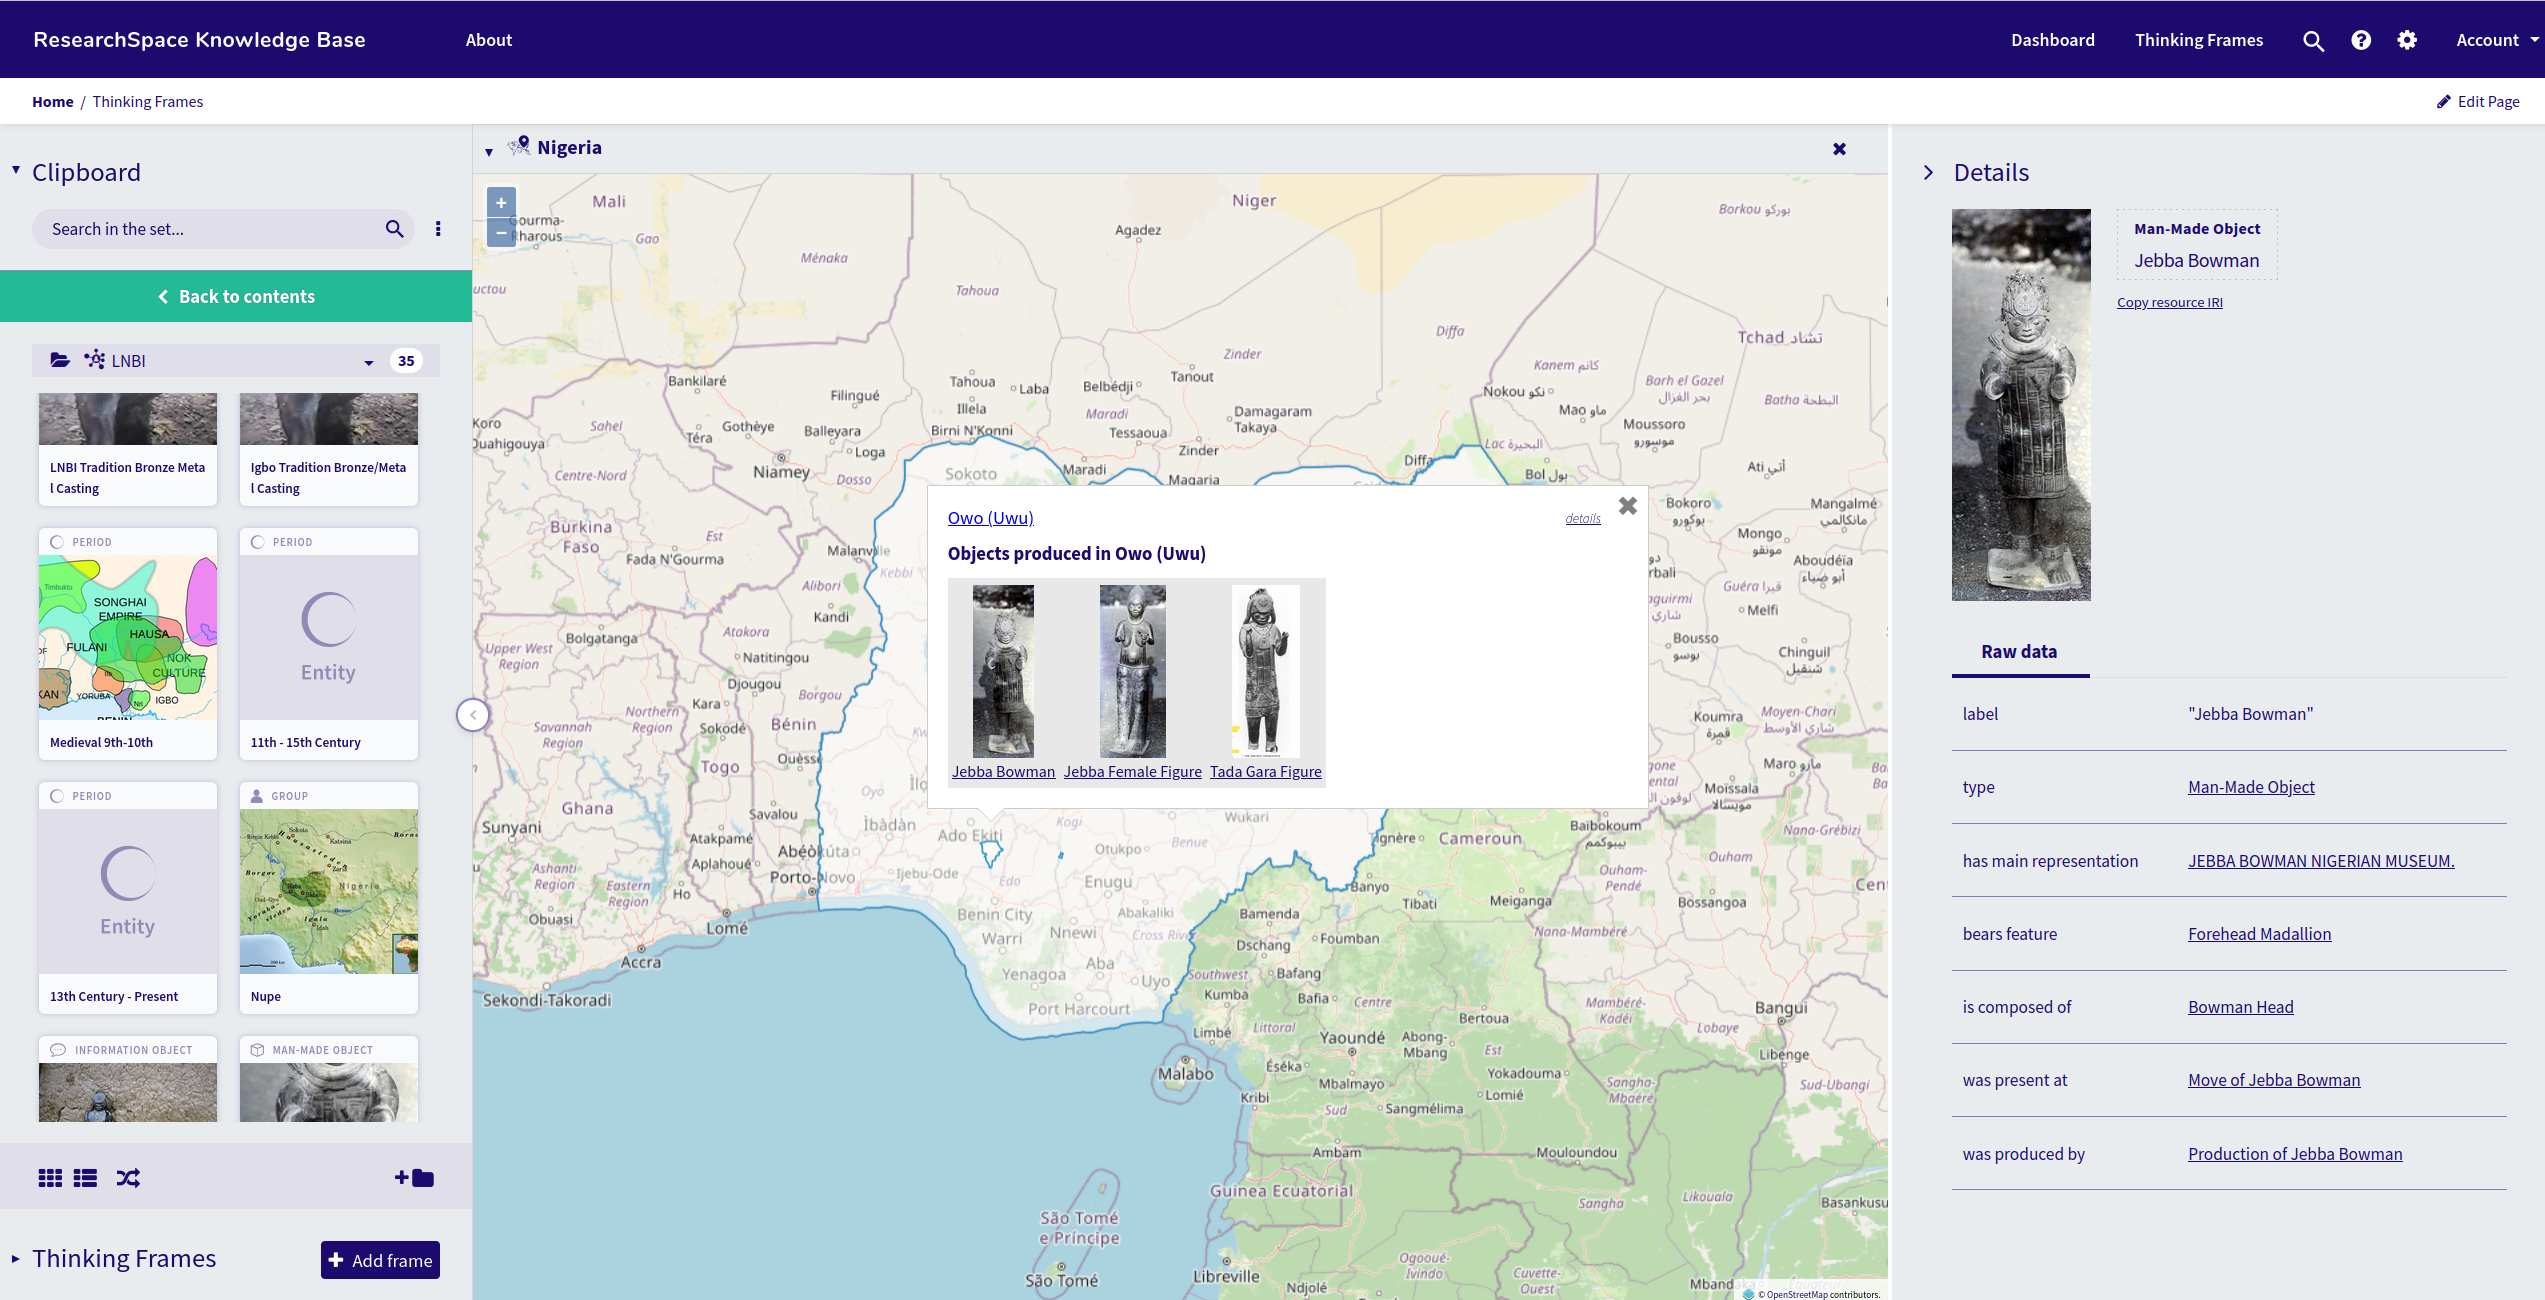
In constructing arguments regarding the origins of casting traditions in West Africa, ResearchSpace embeds information into maps to provide useful spatial visualisations - again with direct access to the detailed information about those objects.
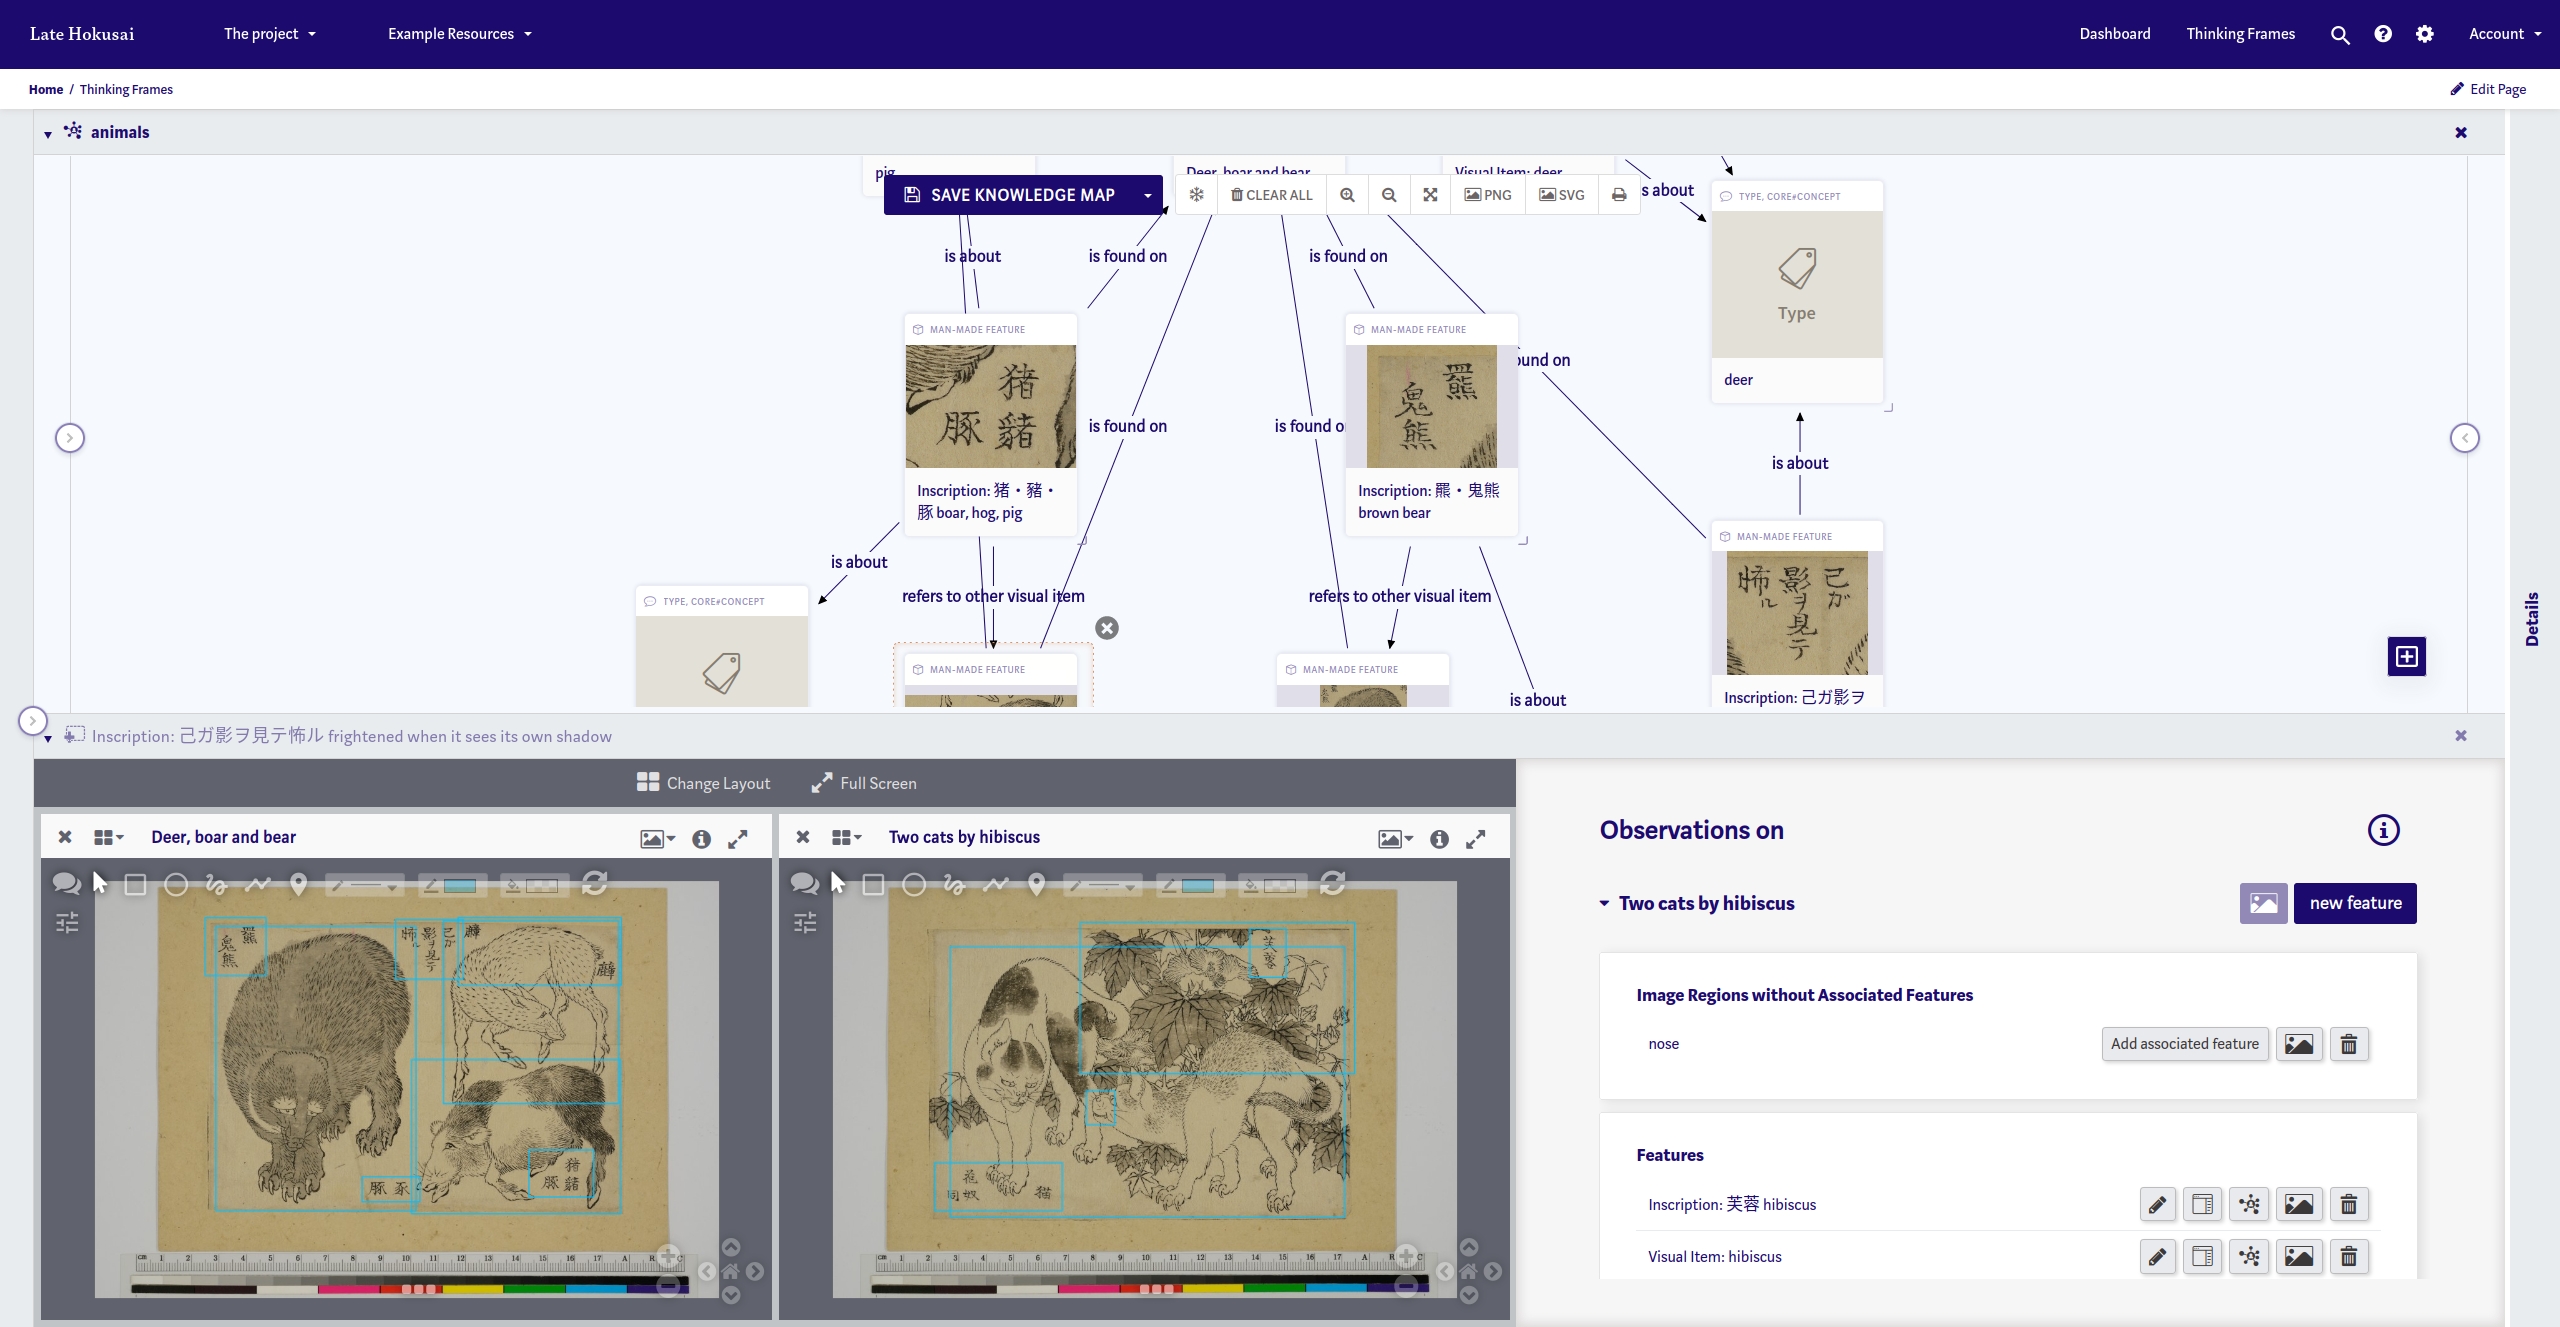
In this screenshot from Late Hokusai, the frames show a semantic network being created directly from an annotation system, which relates to the object, not the image. Annotations are about physical features on the object and are recorded as such. The system ensure that the correct semantics are represented. The annotation system allows for connections, like similarities, references and other relationships, that are then visualised in the sematic network, showing the researcher the growthe of the semantic network.
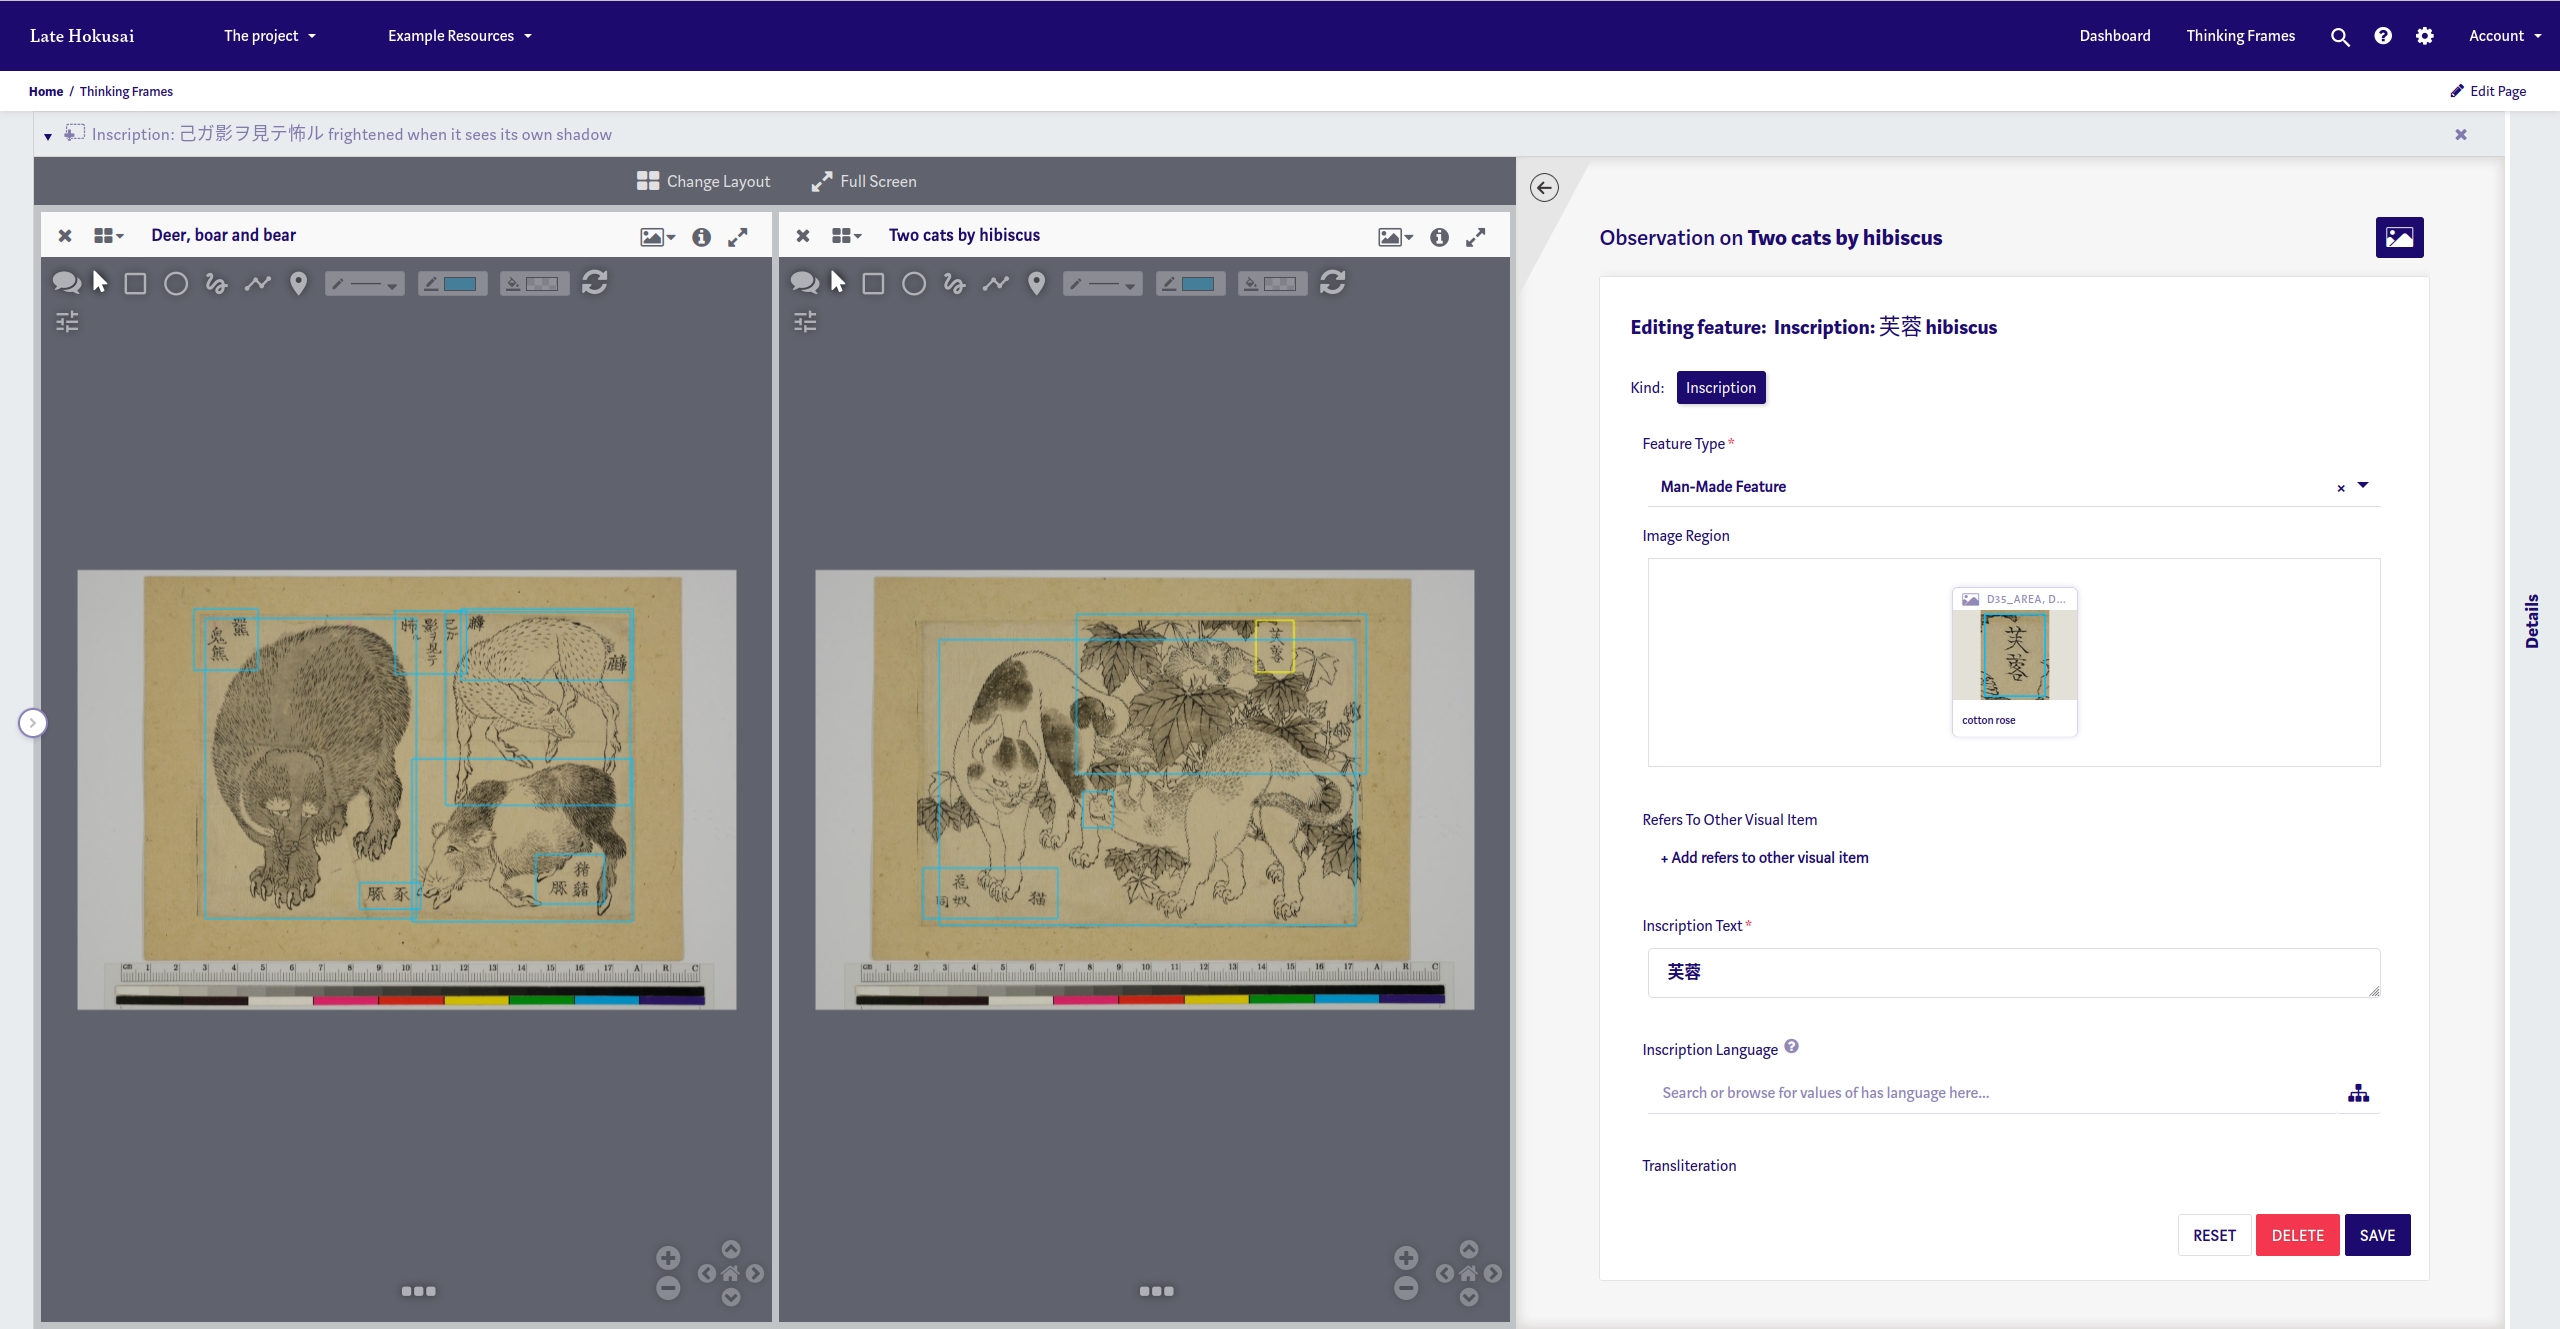
The annotation system evolved as the researcher used it, with different iterations being applied based on the evolving thinking about how to represent the drawings.